Server tracing
Cheetah records short, causally linked events at the boundaries where a server component learns a new fact. It does not keep one span open for the lifetime of a distributed command. This model works across process boundaries and asynchronous HTTP returns, but its spans must be read as evidence about individual stages rather than as one transaction record.
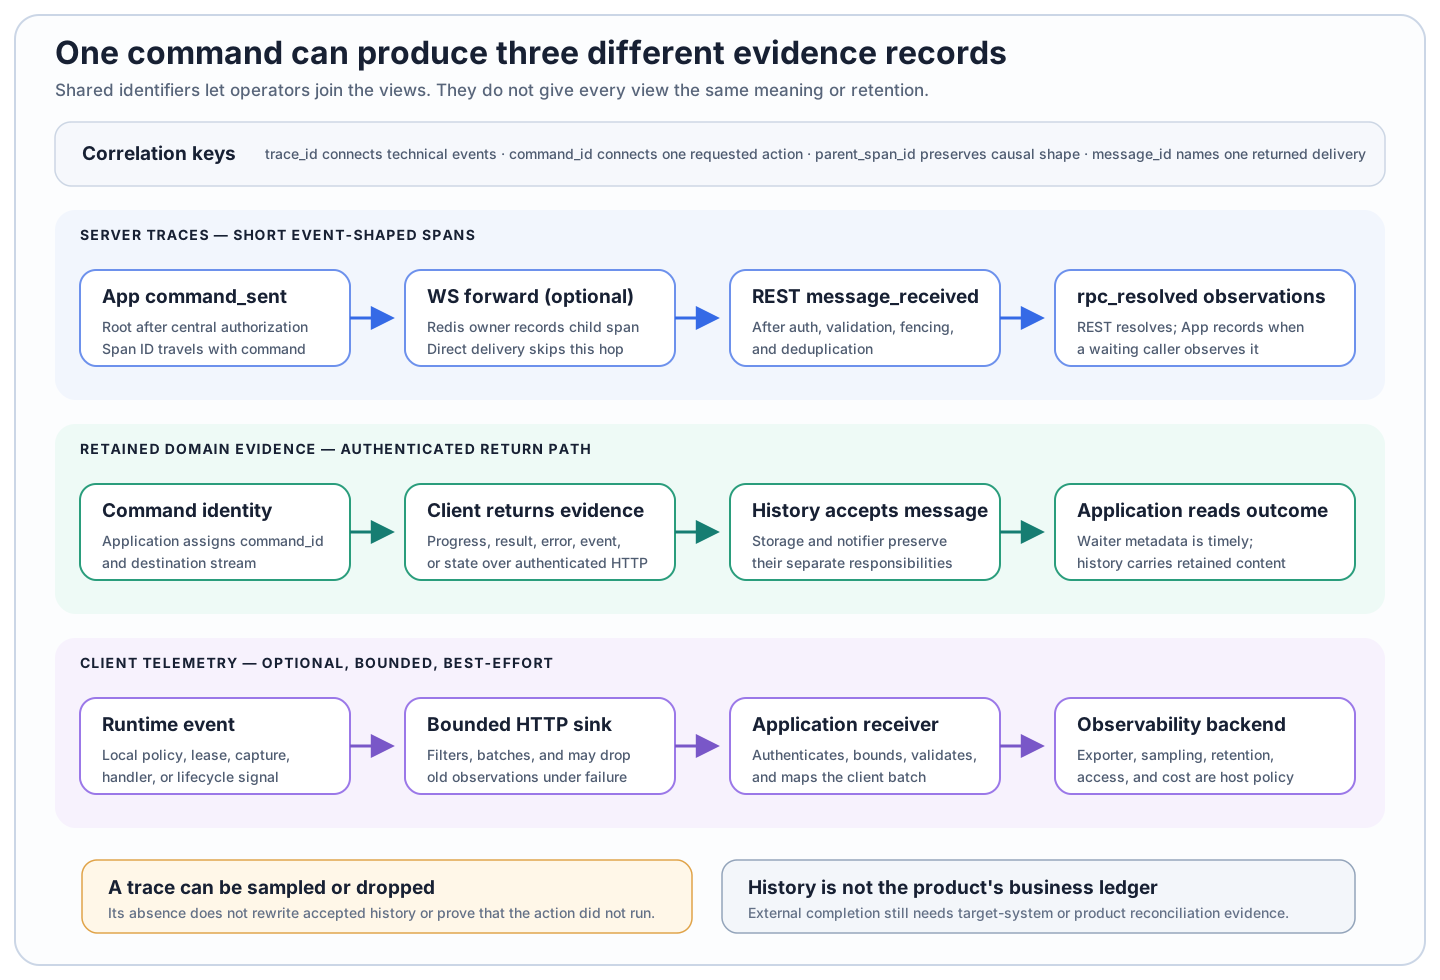
Follow the ordinary command parent chain
After central authorization succeeds, the application role records command_sent before dispatch. If SendOptions.trace_id is absent, the command ID becomes the trace ID. The returned span ID travels with the command as parent_span_id.
When Redis forwards that command to a different process that owns the WebSocket, the dispatcher records a child command_sent event with forwarded_via=redis and propagates its span ID to the client. Direct delivery has no extra forwarding span.
The client returns progress and terminal messages with the propagated trace and parent identities. After authentication, validation, fencing, and deduplication, the REST role records message_received. A terminal message can then produce rpc_resolved at ingestion. If application code is waiting, the App role records another rpc_resolved when that caller observes the future. The two events represent ingestion-side resolution and application observation, not duplicate exports of one fact.
Each supplied tracer creates and finishes its event within the call. RPC wait duration is an attribute on the App observation event; it is not the wall time of an open root span.
Connection acceptance, hello rejection, runtime replacement, connection closure, duplicate ingestion, stale or malformed messages, selected state reports, and timeout paths generate their own events. They can explain lifecycle and fencing without being children of a later command. validation_error remains an enum value, but current request paths normally use the more specific hello_rejected or message_rejected events.
Choose one supplied server implementation
| Implementation | Output | Required deployment work | Finalization |
|---|---|---|---|
NoOpTracer | none | none | none |
LoggingTracer | Python log records with trace, span, parent, event, and metadata fields | configure and protect logs | normal logging lifecycle |
OpenTelemetryTracer | event-shaped OpenTelemetry spans | install the optional OTel dependency group, provide an exporter and backend | the creating host calls shutdown() |
Every role depends on ITracer, so call sites need no conditional instrumentation. A no-op tracer is a valid choice. Redis and production presets can warn when tracing is absent, but they do not create a collector, exporter, sampling policy, or alerting system.
Configure OpenTelemetry output explicitly
from opentelemetry.exporter.otlp.proto.grpc.trace_exporter import OTLPSpanExporter
from servercheetah.module_implementations.tracer import OpenTelemetryTracer

exporter = OTLPSpanExporter(
    endpoint="https://otel-collector.example.com:4317",
)

tracer = OpenTelemetryTracer(
    service_name="cheetah-app-node",
    exporter=exporter,
    set_global=False,
)
exporter=None is intentionally silent. The tracer creates a provider but installs no export processor, so successfully creating a span does not make it observable elsewhere. Use set_global=False when the host already owns the process-global provider or when several role-specific tracers coexist. Use True only when this provider should deliberately become the global provider.
The same composition should pass its selected tracer to every participating node factory and to the Redis dispatcher. Separate processes create their own tracer instances and should use service names that identify their roles.
Let the creating host own shutdown
ComponentSet.stop() does not know that a replaceable ITracer has an OpenTelemetry provider. Quiesce node traffic, stop every component set using the tracer, then call shutdown() on each OpenTelemetryTracer the process created. Shutdown is idempotent in the supplied implementation.
try:
    await components.start()
    await serve_application()
finally:
    await components.stop()
    tracer.shutdown()
Tracer implementations must absorb their own recording and exporter failures rather than change command flow. That resilience makes backend checks essential: absence of an exception is not proof that a collector stored the span.
Trace metadata is an operational data boundary. Use opaque identities, event names, counts, durations, and classified error types. Do not place authentication secrets, arbitrary command payloads, captured page content, or uncontrolled personal data into broadly searchable span attributes. Shared-tenancy composition currently excludes active tracing until a separately verified tenant-aware boundary is provided.
Client-side events can join this technical journey only through the application-owned path described in Client telemetry.