UI integration
Cheetah provides several ways to turn runtime evidence into a human-facing interface. The smallest pieces render one value or protocol record. Larger composites fetch diagnostic data and own an investigation task. The maintained DevConsole combines those views into an operator workspace. A product can instead consume the diagnostics API and build a different experience.
These surfaces do not replace the execution clients. A browser extension, console process, web page, or mobile host connects to Cheetah as a client and can perform work. A diagnostic UI normally reads HTTP evidence about that work. It becomes write-capable only when the host deliberately adds the separate DevConsole control API.
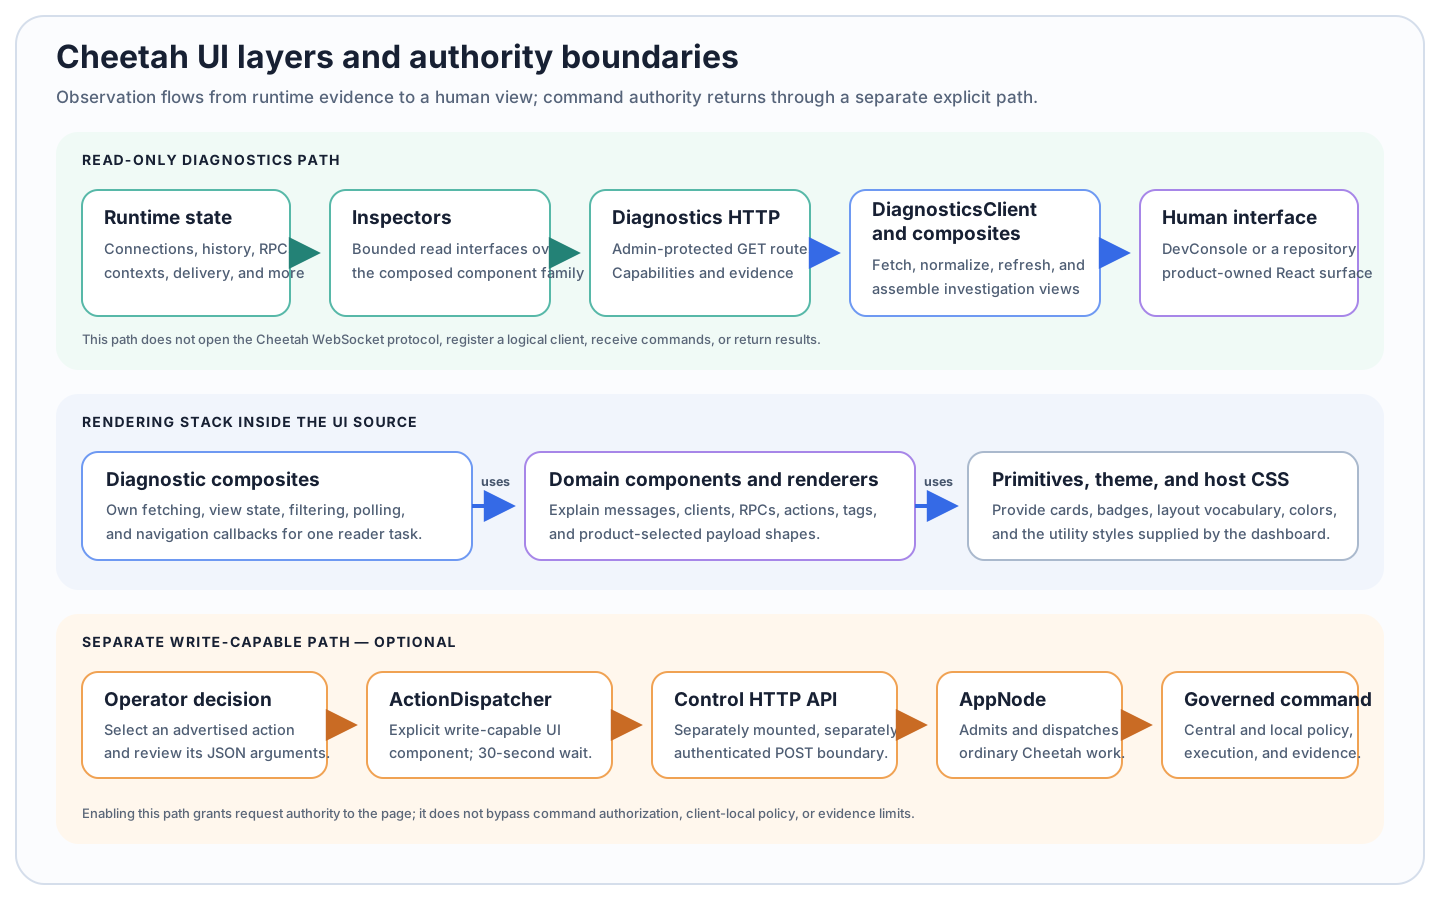
The same components can appear in an observation-only interface or a control-enabled one. The HTTP boundary and enabled props decide which authority the surface receives; visual similarity does not.
Choose the smallest surface that answers the question
| Need | Start with | What the host still owns |
|---|---|---|
| a maintained operator workspace | built DevConsole | build artifact, hosting, authentication, inspector composition, and whether control is enabled |
| a complete history, client, RPC, context, activity, or trace view inside a repository React application | diagnostic composite | source-level UI integration, surrounding layout, access boundary, and capability-aware navigation |
| one Cheetah record or product-specific payload inside an existing screen | domain component or payload renderer | data loading, page behavior, utility CSS, and safe rendering of product data |
| a different framework or product-specific interaction model | diagnostics HTTP API | all presentation, client-side types, completeness handling, authentication, and control design |
The current @cheetah/ui package is private and consumed from source by Cheetah's own dashboards. It does not establish a supported public npm distribution or ship the utility stylesheet needed by an arbitrary React application. The ready-made DevConsole is therefore the maintained integration route. Reusing the component source in another repository product is possible, but the product accepts the source, build, styling, and compatibility boundary.
Keep observation and control visibly separate
DiagnosticsClient and the read-only composites issue HTTP GET requests to the diagnostics router. They do not open the Cheetah WebSocket protocol, register as a logical client, receive commands, or return results.
ActionDispatcher is different. It sends an operator-selected action to the DevConsole control router, which dispatches through an AppNode. The normal Cheetah path still performs central authorization, client-local policy, argument validation, targeting, execution, and authenticated result return. Enabling the control base does not bypass those checks, but it does give the person using the page the ability to request real work.
Mounting static dashboard files creates neither boundary. The host must compose and protect the diagnostics router, and it must separately decide whether to mount and expose the control router.
Follow the task into the reference
Component layers and styling explains primitives, domain components, composites, hooks, utilities, and the source-consumed CSS contract.
Diagnostics client and composites maps the browser-side HTTP wrapper and each investigation-oriented view to its real server capabilities and limits.
Themes and payload renderers covers scoped color overrides and the ordered renderer registry used by MessageCard.
Dashboards and serving distinguishes DevConsole, Workbench, and the older compatibility dashboards, then explains the in-memory and Redis hosting shapes.
For the server routes, administrative authentication, and evidence guarantees, continue with Diagnostics and observability.